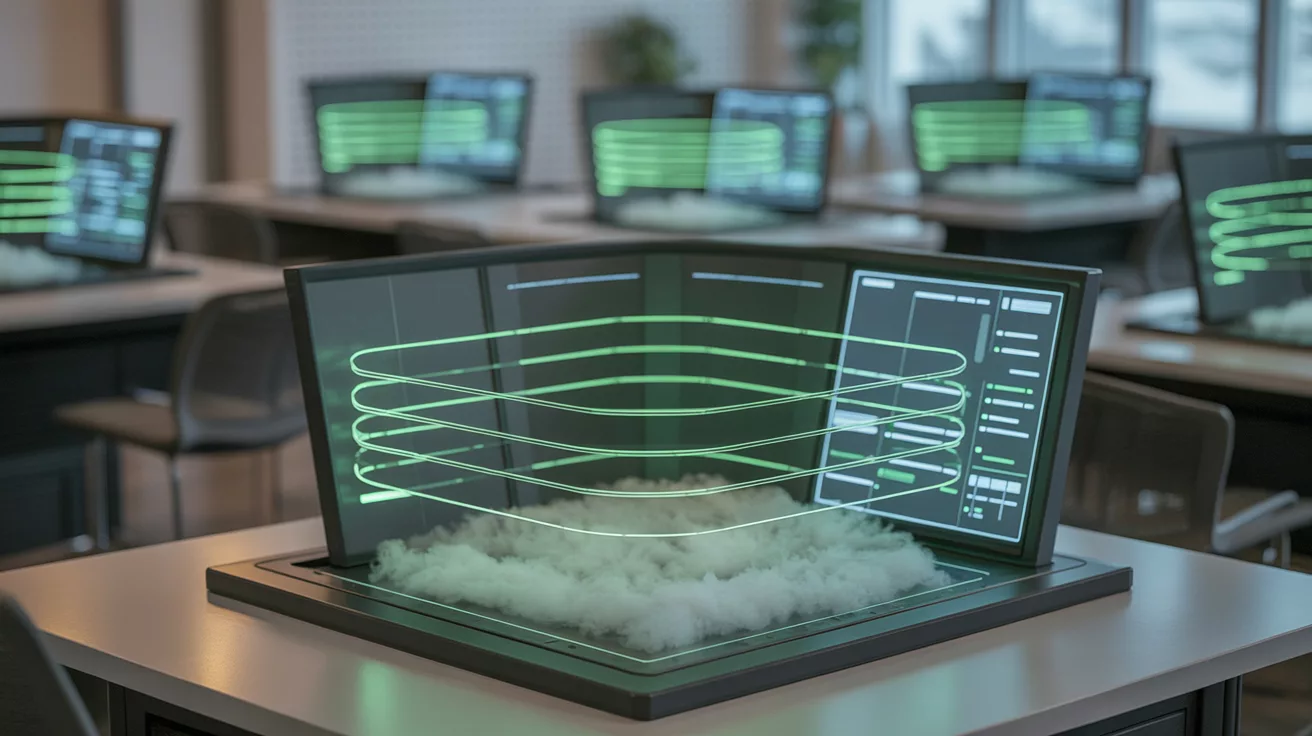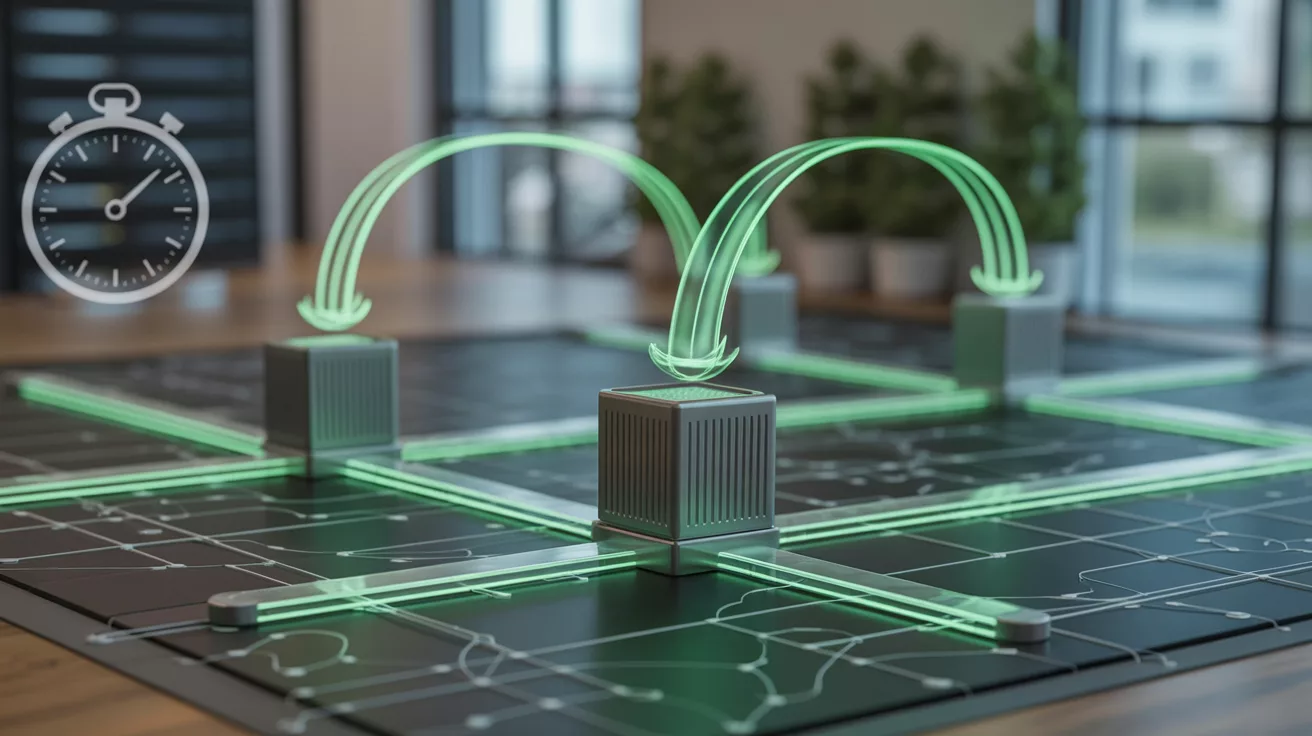
CIOs need reliable decisions, not more dashboards. Monitoring with Prometheus and visualization in Grafana provides facts about usage, errors, and times. In combination with IDLS as an integrity layer, these signals become ready for decision-making. This allows interfaces and VMs to be controlled in a targeted manner: sleep mode during quiet time windows, scaling during peaks, clear maintenance windows. The result: greater stability, lower costs, and measurably fewer emissions in terms of Net0. The leverage lies in leadership, clarity, and structure: the technology follows these guidelines.
Controlling interfaces instead of just monitoring them: Prometheus, IDLS and Net0
APIs connect systems, teams, and partners. They cost money, time, and energy. The question for C-level executives is not which tool to use, but how to make reliable operational decisions. The answer begins with observation, continues with structure, and ends with impact: stability, cost control, and Net0.
Monitoring that enables leadership
Prometheus collects metrics as time series, Grafana makes them readable. Three signals are crucial:
- Usage per time unit: Who uses what, when.
- Error rates 4xx and 5xx: Where do risks arise for customers and operations.
- Response times: When does the process become sluggish and why.
It’s not the snapshot that counts, but the pattern. Daily peaks, quiet night windows, recurring outliers. This results in leadership: rules instead of ad hoc reactions.
From insight to impact: Net0 in operation
Net0 means the same performance with less energy and emissions, without risk to the business. Monitoring provides the basis for driving planned relief:
- Sleep mode for VMs and services when interfaces are reliably unused at night.
- Cushioning load peaks when a process boots up on weekday mornings. Scale up and scale back down in a targeted manner.
- Set maintenance windows when the data shows that this is the quietest time.
This turns metrics into an operational ritual: observe, evaluate, refine rules, reduce energy and costs.

Structure before technology: IDLS as the backbone
Monitoring is only as good as the structure behind it. IDLS creates a consistent data and integrity layer. Flows are traceable, responsibilities are clear, and changes are auditable. This minimizes misinterpretations and makes measures reliable. Read more in the article Beyond Point-to-Point: Building Scalable Data Integrity with DLS. With IDLS, monitoring signals become actionable: less debate, more action.
Guidelines and responsibility
- Service availability: Sleep mode only where SLAs allow.
- Escalation and alerting: Link thresholds to ownership. Who decides, who acts.
- Transparency: Document changes, measure effects in terms of costs, downtime, and CO2.
Quick start in 30 days
- Clarify goals: Stability, costs, Net0. What is the priority?
- Define metrics: Requests, errors, latency. Thresholds per interface.
- Dashboards and alerts in Grafana: Daily patterns, heat maps, top errors.
- Test rules: Identify a non-critical interface, pilot sleep mode for four weeks.
- Measure effects: Availability, costs, energy. Transfer lessons learned to governance.
Conclusion
Those who only monitor APIs react. Those who understand patterns and clarify structures control. Prometheus and Grafana provide the facts, IDLS provides reliability, and Net0 provides the target image for efficient, resilient operation.

Ready to take your operations to the next level?
You check Net0 potential in your operations. We identify measurable levers in your interfaces within ten days.
Dategro partners with mid-sized industrial companies to transform disconnected commercial data into unified performance dashboards—without replacing core systems or creating IT headaches.


